 You can create a node-red dashboard for IOT and Home automation and for a myriad of other applications.
However the nodes that allow you to do this aren’t part of the core nodes and need to be installed separately.
The node-red-dashboard node is installed using menu>manage palette>search node-red-dashboard>install.
More details are available here if needed.
If you are a developer the latest version of the dashboard node provides an api for creating your own dashboard widgets. details are here.
The node-red-dashboard node installs a collection of nodes under the dashboard category.
You can view dashboards using the same url as node-red admin but with /ui added e.g http://localhost:1800/ui.
Note: The dashboard port is the same as the admin port
The path can be changed in the settings.js file
ui: { path: "ui" },Creating a Node-Red Dashboard
The easiest way to become familiar with the various dashboard widgets is to create a dashboard using them.
This video shows you how to create a basic dashboard.
Here is the flow used in the video
Dashboard Layout
The dashboard layout should be considered as a grid.
The basic element is a widget which are placed in groups.
Group elements have a width in units where,by default, 1 unit =48px wide.
Widgets also have a width which by default is set to auto which means that it will be the width of the group.
The documentation states:
The layout algorithm of the dashboard always tries to place items as high and to the left as they can within their container – this applies to how groups are positioned on the page, as well as how widgets are positioned in a group.
Given a group with width 6, if you add six widgets, each with a width of 2, then they will be laid out in two rows – three widgets in each.
If you add two groups of width 6, as long as your browser window is wide enough, they will sit alongside each other. If you shrink the browser, at some point the second group will shift to be below the first, in a column.
It is advisable to use multiple groups if possible, rather than one big group, so that the page can dynamically resize on smaller screens.
Layout Example
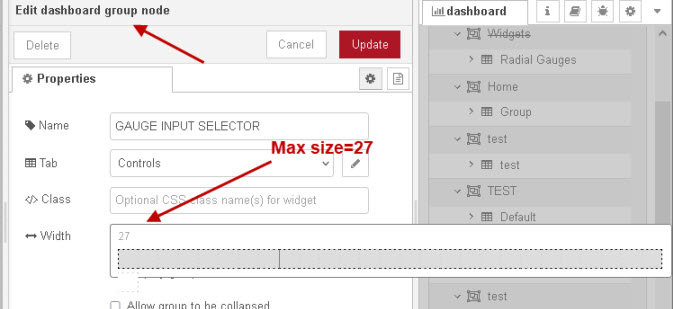
If you change the width of a group then you will see that it has a maximum size. This is effectively the size of the display page.
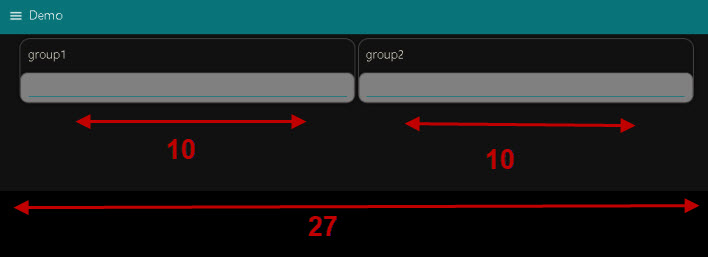
The dashboard is filled horizontally so if the max size is 27 and you create two groups each 10 wide then they will it side by side as shown below:
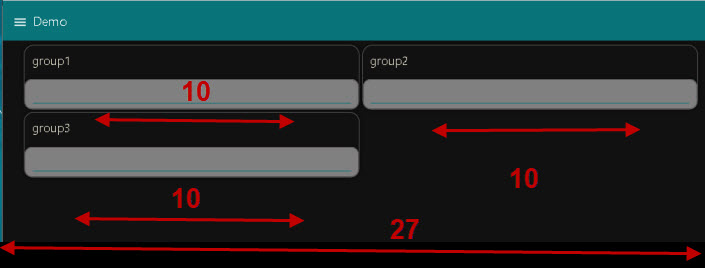
If you add a third group then it will be placed below as shown below:
Group and Widget spacing
If you look at the screen shot then you can see spaces between groups and widgets the actual space is set on dashboard>site tab.
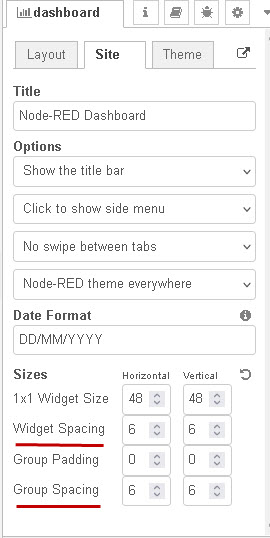
Adding Widgets
When adding widgets to a group then the size is set to auto by default which means it will fill the width of the group.
However you can change both the vertical and horizontal size. If I place three text widget in group1 and set the size of each to 4 *3
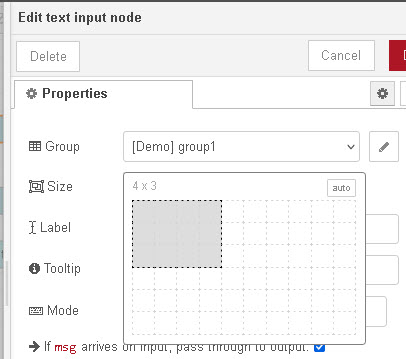
Now notice how they fit into the group which is 10 units wide. Also notice the widget spacing and how the groups are now positioned on the page.
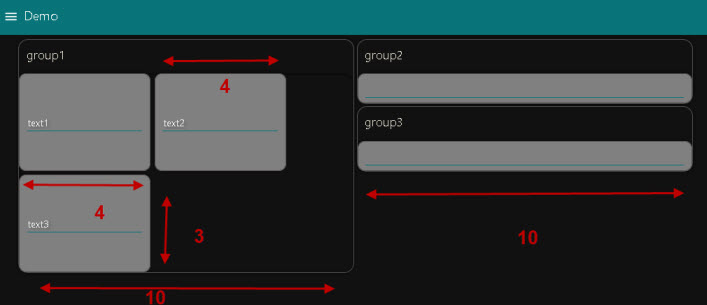
Note: Changing the zoom settings on the browser as well as changing the browser window size will affect the display. In addition the screen size of the device you are using will also have an impact so you should test on a variety of devices.
Styling Themes, Groups,Widgets and Widget Elements.
Theme style
There are three options – light,dark,and custom, and this is set on the dashboard>theme tab
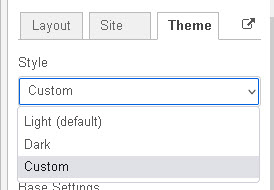
Styling Groups,Widgets and Widget Elements.
This is done using a template node with the template type set to added to site <head> section.
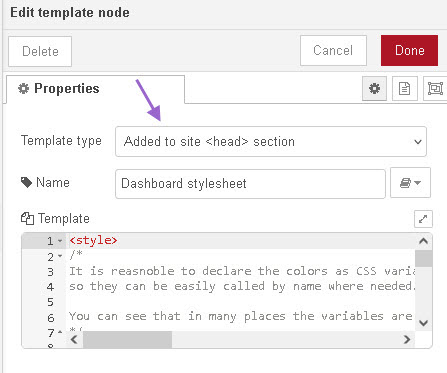
The styles defined in this node will be available in all flows.
The following screen shot show use of the template style to create a dashboard.
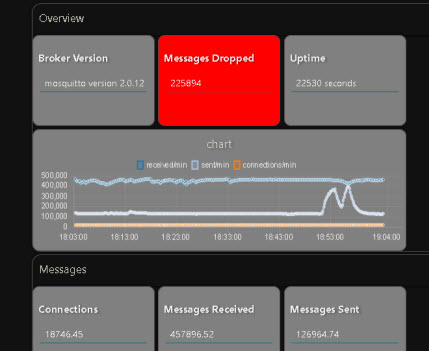
The actual style I got from a forum post here the author was hotNipi and I found lots of useful information there.
I have included the template as a download in case you can’t find it on the forum.
Changing background colour of widgets (buttons, text input)
If the widget has a class property as shown in the screenshot below.

The you need to create the class using the template node and add the class name to the property as shown above. Here is the code for the class.
.text-background
{
background-color:red !important;

}
You can also do this dynamically using the message object with the className attribute as follows
.text-background
{
msg.className="text-background";
}
Styling Labels and Values
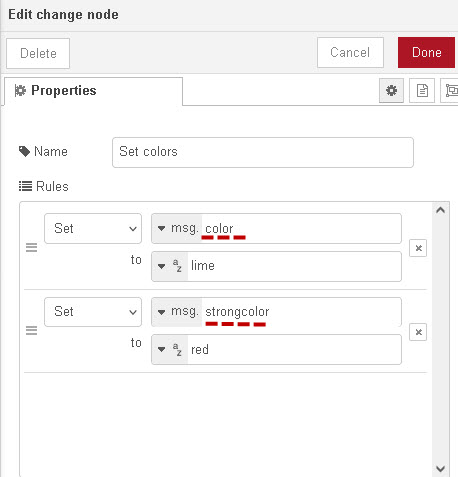
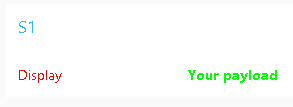
Here is an example flow that consists of an inject node that send a simple text string and a change node to set payload properties for the colours.

The change node is shown below
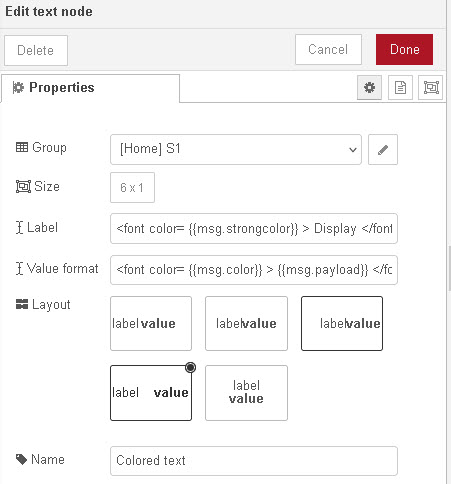
The work is done the text node where HTML is used to change the font colour which is passed into the node as variables from the change node.
Result
Resources:
Dashboard Template
- video-Using the control ui node
- video – Using the Node-Red Dashboard Switch Node
- How to Create a Node-Red MQTT Dashboard
Common Questions and Answers
Q- Are there additional dashboard nodes available?
A- Yes there are addition dashboard nodes like the table node and they are installed like any other node.
Q- Can I access my dashboard on a mobile phone?
A- Yes it is a web page and can be accessed by a browser on the phone.
Q- Can I access my dashboard over the Internet?
A- Yes but it is important to make it secure. See here for using nginx.You can also setup a VPN and access through that or use VNC.
Resources:
There are additional dashboard nodes available and more are regularly made available. You can find a list here.
Related Tutorials :
- Using The Node-Red Dashboard Template Dashboard Node
- Using the Node-Red Chart Node
- Using the Control UI Node
- Modbus Node-Red Dashboards and MQTT Modbus Bridge


Hi Steve, thanks for this post which really helped set me in the right direction on this.
I have pretty quickly set up a dashboard that shows the latest output form several remote sensors. Each sensor has a corresponding gauge on the dashboard
I have tried to minimise duplication, so whichever sensor sends in a reading, all the processing of the incoming message prior to sending to the gauge widget is done in a single pathway through a single set of nodes, then right at the end, a switch node uses the sensor ID in the message to direct the output to the correct dashboard gauge.
This gets ugly pretty quickly, because each device doesn’t just have a gauge, but also a couple of text fields and a graph, etc. This means I have a proliferation of dashboard nodes with one of each node multiplied by the number of sensors on my dashboard.
It’s also pretty yucky to extend or maintain as each new sensor means copying a bunch of nodes, and any change to a node needs to be done in multiple places
What I am missing to make this elegant is either a way of invoking nodes from WITHIN another node.
If I could do that tehn maybe in my fucntion node I could declare an arrays of nodes (Gauges[], Graphs[], etc) orand invoke Gauges[sensorIndex] and Graphs[sensorIndex] so that I don’t have to have spaghetti links to all my various nodes on the editor.
Or I guess instead of using an array I could use the dashboard group for each sensor to invoke dashboardPanels[sensorIndex].gauge
are either of these possible?
Or maybe I need to create my own node called “dashboardPanel” which coalesces a set of UI widgets, and incorporates all the processing required for each. Then have one of those dashboardPanels for each sensor…
How many sensors are we talking about and do you need all of them displayed at the same time or can you hide them when not selected?
rgds
Steve
four at the moment, client asking about moving to 6, I’d like to future proof against further expansion,
but to clarify, I am not really worried about the amount of gauges displayed to the user, I am more concerned with the proliferation of nodes on my editor that are essentially identical other than which gauge they ultimately update. I try to keep a single set of nodes for common processing steps prior to updating the gauge but feel I’m currently forced to then have a switch node with 6 outputs to six gauges and then the same for the graph and the same for the label, and the icon, etc. I’m looking for a way that the nodes go ProcessingNode1->ProcessingNode2…->updateGauge. Where updateGauge is a single node to update whichever gauge is appropriate.
The closest I have got is to have a link-out node called “update gauge” which goes out to a separate tab that has the switch node and the six gauges. that way my “main” flow is uncluttered.
Perhaps this is really the best way after all, because it achieves two things
1. keep the main flow clean and easily readable
2. keep the switching between gauges visually self-documenting rather than hidden in a node.
It’s just that my inner engineer is screaming that this should either be an array of gauges or a collection of gauges so that I use the device index number to select the correct gauge to be updated.
I mean under the hood somewhere, node-red is taking my visual flow and translating it to “send msg to the node with the ID “1223xyz”, I just want to take control of that 🙂
Thank you for the wealth of information you provide in a concise and well documented format.
My latest challenge with the Dashboard UI is not everything refreshes to the latest change.
Is there a best practice for how to set up a flow and have it run every time the dashboard UI is refreshed?
Thank you
I assume you mean the dashboard needs to be refreshed? I usually use an inject node and refresh the dashboard every second. Is that what you mean or have I misunderstood.
Rgds
Steve
I join the group here in congratulating and thanking Steve for his awesome tutorials, making the learning curve less steep for us all.
Kudos Steve! Keep up the good work.
Oscar
Tks for the comments glad that you find the site useful.
Rgds
Steve
Thank you for a very useful tutorial on the Node-RED dashboard. I am just getting into using WeMos and ESP32 modules for home automation and Node-RED is looking to be a good tool for visualizing and controlling devices so the tutorial was spot on!. I am currently using Google Home minis via IFTTT and Adafruit.io to give word commands to WeMos and ESP32 devices (having looked at many less reliable/slower combinations). I am currently looking to replace the Adafruit.io route with Node-RED and Mosquito MQTT running on a Pi. Do you have any recommendations for doing it in a better or more direct way? Regards Steve
No
That is the way I would go.
Rgds
Steve
Hello !
I´m doing exactly the same thing, using the same elements.
If I may, let me suggest to round up your set-up, to also use a mobile app for visualization.
In my case, after some research, I decided for “MQTT Dashboard”. I have an Android phone so I found it in Play Store. I don´t know whether they vave an iOS version.
I cant get it to display /ui error message is please add som ui nodes but i have them in
Hi
Can you send me a screen shot of what you are getting using the ask steve page and I’ll take a look
Rgds
Steve
Looking forward for a windows version instead of reinventing the wheel…
If I installed in home directory by accident, can i copy the contents of the created user/node_modules directory into the correct ~/.node-red/node_modules folder?
I think so I would try it.
rgds
Steve
Great tutorial. Thanks. I read step by step. I fully understood every concept. The illustrations help a lot. Then I saw the video. It enhanced my understanding of the whole thing and every concept. Thanks for your Magnum Opus.
This is a HUGE amount of work you are putting into this site – and tons of people arecbenefiting from it – THANK YOU !
Hi, is it possible for a tutorial on how to access (safely) nodered across the internet with nodered running on raspberry pi. Many thanks.
Hearty Greetings, I am 72 years old retired Telecom Engineer and my hobby is IoT. I go through your article and videos on Node-Red and it is really exhaustive. You expose all most, all the options and features of Node-red and it will be more than enough for some one to master it. Thank you so much for your contribution to beginners like me.
With Great Regards, Ragothaman R. from India.
Hi
Glad you found it useful.
Rgds
Steve
Steve,
Thank you so much for all the work you do in building and continuing to expand your website of information. You present the information in a logical, easy to understand method. Because of that, when you have covered something I’m interested in learning, your site is the first I start with. From your pages I’ve learned enough about Node-Red and MQTT to let me begin to control the tasmota’d sonoff devices.
Have you dabbled with the programs openHab or HomeAssistant?
Hi
Tks for the nice comment and glad you find the site helpful.
I have dabbled with homeassistant and it is on my list of things to do.
rgds
Steve