
The node-red data logger lets you log incoming data into a text file.
It can be used for logging MQTT sensor and device data to log files either as a single file containing multiple topics or multiple files based on topic.
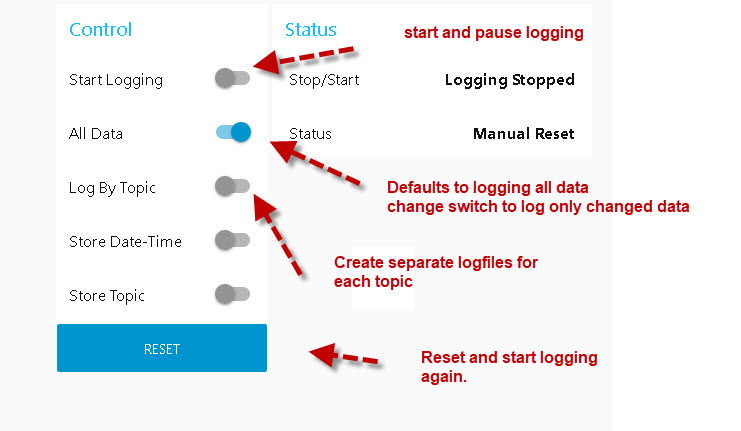
It is controlled using a node-red dashboard as shown below.
Starting The Flow
When starting the flow it defaults to logging all data to a single log file. (see log files names and sizes below).
The data source in the flow is MQTT, but can be other data sources as the data is passed using the msg.payload.
The data source doesn’t need to provide a topic unless you are trying to log by topic.
By default only the payload is logged but you can also log the topic, and a time stamp.
By default all data is logged.
Logging by Topic
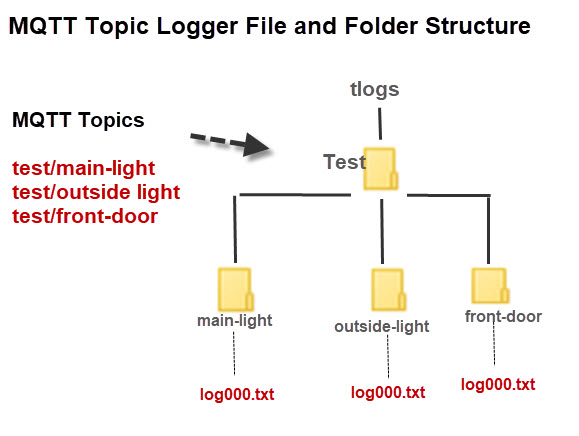
If you enable the switch to log by topic the the logger creates separate log files for each topic and follows the MQTT topic hierarchy as shown in the schematic below:
Log File Names and Sizes
The current maximum log file file is 5MB after which a new log file is created the names use the structure
logxxx.txt
where xxx is a number starting with 000 so the first log file is log000.txt.
If you want to change these settings you will need to edit the store data function node.
Flow Overview
The node consists of several switches for setting the various options.
These switches are initialized using an inject node and reset button.
The control logic for these switches is contained in the Set Switches function node.
The switches store their settings in a flow object which can be read in the store data function node.
Each function node starts with this line
var local=flow.get('local') || {};
The MQTT node will need to be edited to reflect your system. You will need to change the broker and the topic.
You could add additional MQTT nodes to subscribe to multiple topic hierarchies
Using the Logger
You need to set the various option i.e. log by topic etc before activating the start logger switch.
Any change to the switches after logging has been started are ignored.
Stopping the logger actually pauses the logger as if you start it again it will continue to log without resetting any counters or file names.
To start a new log then use the reset button and manually clear the existing logs or the logger will append to them.
By default it logs all data but you can change it using the slider control to only log changes data.
This works very well when logging by topic.
Performance
In the tests I did uses node-red and the mosquitto broker on a Raspberry pi I logged 6000 messages (40 bytes) at 173 messages/second without data loss.

Video How to Log MQTT Sensor Data in Node-Red
This video covers the older version of the logger however the fundamentals haven’t changed. The newer one is easier to use.
Flow Download

Comments and New Feature Requests
Grateful any comments and ideas for new features.
Related Tutorials and Resources
- Storing Data in Node-Red Variables
- Using The Node-Red Library
- Understanding and Using Buffers In Node-Red
- Working with JSON Data And JavaScript Objects in Node-Red
- Node-Red – Storing IOT Data in a SQL Database
Hi Steve, this rutine is amazing! you saved me lot of hours of work. Thanks to share your solution
Glad it helps. I do Have a version 2 if you are interested but I haven’t finished testing it but I have used it and it seems to work ok. If you want it let me know and I’ll email it.
rgds
steve
I would love to also test V2 😊
Hi
It is here let me know what you find as I haven’t really had much time to test it
https://stevesnoderedguide.com/download/data-logger-v2
rgds
steve
Handy good working and great commented program.
Hi Steve,
Thank you so much for your work! I have managed to use this to store some MQTT data from an Arduino in my lab. I was just wondering if there was a simple way to have the text file save only the time and payload without the additional text. I have done some troubleshooting and made a few changes to the code that I thought should change the output, but I am still getting data that looks like: {“time”:1631729148381,”payload”:24.45}
Is there a way that the text file could simply be something like:
1631729148381,24.45
Thank you for taking the time to read this comment, your help is greatly appreciated!
Maggie
I’ve taken a look and on line 8 of the store data function you should see
var store_time=local[“store_time”] ||false;
if you use
var store_time=false;
that should work
Rgds
Steve
Hi Steve,
Thank you for your response! Unfortunately making that change only removed the whole time portion of the output. I am simply trying to remove the words “time” and “payload” from the text file because I would like to input those two values into excel, but its not possible with the extra words, apostrophes, and colons. Ideally the text file would contain just the Unix timestamp and the payload value separated by one identifier (like a comma).
What my output looks like: {“time”:1631729148381,”payload”:24.45}
What I would like it to look like: 1631729148381,24.45
I have created a small program to use as a work around for the meantime, but this would save a lot of time.
Looking forward to your response, and thanks again!
Maggie
Line 115
change
payload=JSON.stringify(payload);
payload=t+payload;
or
payload=t+”,”+payload;
rgds
steve
Edit to my previous post a moment ago (it’s still awaiting moderation, can’t edit or reply to it).
I just noticed that the status under “log sensor data” is now updated with text in the format of “home/pi/logs/rtl_433/Acurite-Tower/7287/time/log000.txt” (changing regularly) which is exactly what I’d expect to see, based on the topics that I know are being sent.
However, my “logs” directory is still empty. Getting so close!
Hi
Are you logging by topic if so change it and see if that works
Use the ask steve page to get in touch if you still have problems
Rgds
Steve
I’m not getting any logs in /home/pi/logs, unfortunately.
1) I edited the MQTT source to match my installation (in fact, I used an existing working one and just tied it to the “Store Data” function). I can see things working in the debug for that.
2) I turned on all of the switches on the dashboard, including “All Data” and I’ve watched the switches in NodeRed change to “on”
3) I flip the “Start Logging” switch and can watch it change in NodeRed, and the status Stop/Start now says “Logging started”
4) I even manually created the “logs” folder to make sure that wasn’t an issue, but nothing shows up in there
5) The data I’m working with comes from RTL_433, using its built-in MQTT function, which puts out messages in string() format, not JSON – is that a problem?
I really want to use your tool to figure out which devices are out there and transmitting which I haven’t yet setup (using some switch nodes to filter out the known ones eventually). I really appreciate all of the work that went into this
Hi Steve,
Good stuff!
One question regarding the time stamp. What would be the best way to get the logs with a time stamp (date/time) for each message? The logs show “time: 1607672155671” (The time at the moment is 3.52PM 11/12/2020). What I’m missing here?
Cheers,
Luciano
The time stamp is normally store in Unix timestamp format as it is easier to work with. You need to convert it later for display. Python as functions for doing that take a look here
https://www.programiz.com/python-programming/time
rgds
steve
Great article, very useful feature!
Would be possible to extend it by adding a “live” MQTT log viewer, to display in node-red a scrollable list with the last (for example) 50 MQTT messages?
I’ll try
Good Stuff Steve
I’m looking to log live data (last 50 events) in the dashboard. What would be the best way to do this, can you point me in the right direction?
Hi
I have already developed a flow if you contact me on the ask steve page I’ll send it to you
rgds
steve
Hi Steve, cool stuff!!!
I the topic of a 50line console live log windows, I am also intereasted how todo that.
Hi
The flow is here.
http://www.steves-internet-guide.com/download/mqtt-traffic-monitor/
The monitor will display the last 10 messages.You need to change this line in the function node display messages
if (data.msg.length>10)
Hello Steve, nice guide and very helpful. Thanks for sharing your knowledge.
I’ve got everything to work except the log by topic function. I got a sensor that publishes 2 topics. In the mqtt subscribe node I use wildcard to get both of these topics and connect them to the function. Sadly regardless of the switch options no hierarchy with different directories is created. Both of them are logged in the same file.
Are there any additional guidelines to follow, such as naming the files etc.
Hi
No naming to do. Can you send me the flow as the one I’ve got is a newer version. I will check it. Also if you could forward your data via mqtt to the broker at
test.mosquitto.org on topic sig/edo/test then I can check it with your data.
Rgds
Steve
Hi, Steve, thanx for you work!
It is just what I need 🙂