
 The table dashboard ui widget node is used to add tabular data to a dashboard.
The node is based on the tabulator module which you can read about here and see examples here.
The node is not installed by default but needs to be installed using the node manager.
The table node can be used for creating simple test tables to more complex and richer tables as shown in the screen shots below:
Reviewing the Node Help
Each column can contain data of a particular type. For example a column could contain HTML data or progress data. The format options are:
- Plain Text – Simple text values.
- HTML – Rich html to allow text Formatting – NOTE: this is raw un-sanitised HTML.
- Link – URL link to a web page.
- Image – Source (src) URL of an image to display.
- Progress – a progress bar from 0 to 100.
- Traffic – Red/Amber/Green indicator light set by numbers in the range 0-33-67-100.
- Color – HTML color name, or hex value (#rrggbb) to fill the cell.
- Tick/Cross – Tick or Cross symbol, boolean true/false, numeric 1/0 or text “1”/”0″.
- Stars – Number of stars – numeric 0 to 5.
- Row Number – Current row number.
Examples
The following examples use the inject node to create the data object with column formatting is done in the table-ui node itself..
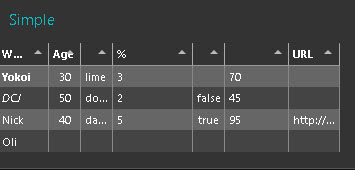
Simple Table
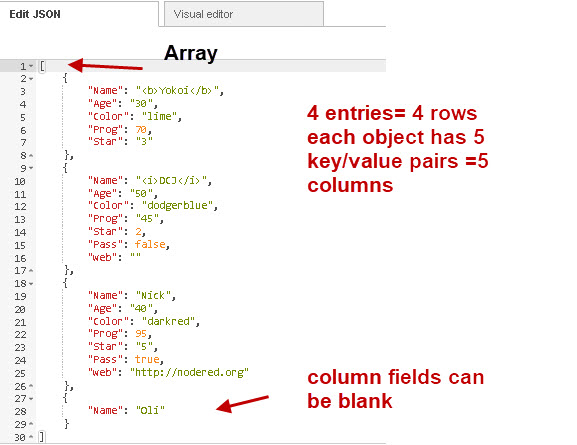
The inject node Looks like this:
[
    {
        "Name": "Yokoi",
        "Age": "30",
        "Color": "lime",
        "Prog": 70,
        "Star": "3"
    },
    {
        "Name": "DCJ",
        "Age": "50",
        "Color": "dodgerblue",
        "Prog": "45",
        "Star": 2,
        "Pass": false,
        "web": ""
    },
    {
        "Name": "Nick",
        "Age": "40",
        "Color": "darkred",
        "Prog": 95,
        "Star": "5",
        "Pass": true,
        "web": "http://nodered.org"
    },
    {
        "Name": "Oli"
    }
]
It is an array of 4 objects (4 rows) with each object having5 entries (key/value pairs) although they don’t need all 5 as the last entry shows.
The column names are taken from the object key names and so is the column order.
There is nothing done in the table-ui node and so the incoming data is displayed as simple text.
Example 2- Richer Table
This is slightly more complex and add colour and star ratings. We do this by adding formatting to the columns in the table-ui node.
The payload which contains the table data is indentical to example 1 and created in the inject node.
An entry must be created for each data column by clicking on the add column button.
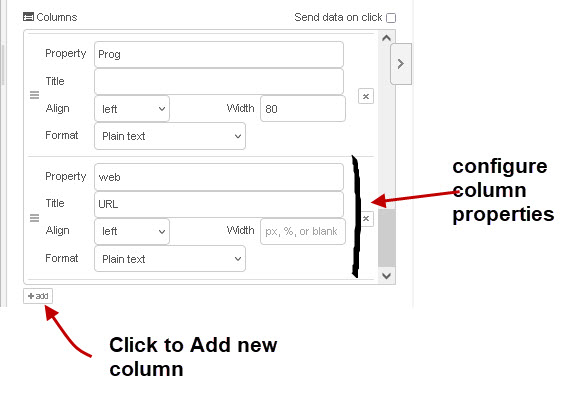
For each column entry configure:
Property= key name found in the data
Title =Used for column Header
Align=alignment in column
Width=width of column
Format= type can be text,HTML,Progress etc see docs
The final result is shown below:
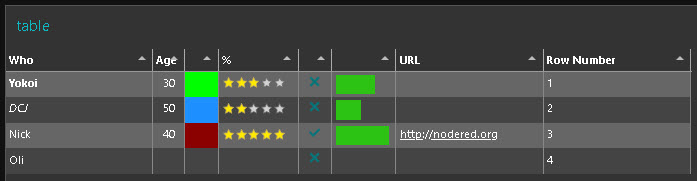
Data is passed into the node as an array of objects. Each array element is a table row entry and each object value is a column.
Below is example data taken from the above examples:
The flows above are taken from the examples on Github and can be downloaded below:

The column layout can also be done in the proceeding node making the table-ui node more flexible.
Formatting is passed in the control_ui property
The message object is shown below. It produces the same table as the rich table (example 2):
msg.ui_control={
    "tabulator": {
        "layout": "fitData",

        "columns": [

                      {
                "formatter": "html",
                "editor":"input",
                "title": "Who",
                "field": "Name"
            },
            {
                "formatter":"plaintext",
                "title": "Age",
                "field": "Age"
            },
                        {
                "formatter":"color",
                "title": "Colour",
                "field": "Color"
            },
            {title:"Ratings",
            field:"Star",
            formatter:"star"},

             {title:"Progress",
            field:"Prog",
            formatter:"progress"},

        {title:"Pass",
            field:"Pass",
            formatter:"tickCross"},
   {title:"Web Page",
            field:"web",
            formatter:"link"}
        ],


    }

};

return msg;
Video
Coming Soon
Related Tutorials and Resources:
- Node-Red Dashboards
- Using the Control UI Node With Flow Example
- Using the Dashboard Template node
- Using the Node-Red Template Node
Hi Steve,
have you noticed that the ui_table version used in Node-RED is based on tabulator V4.4? The actual version of tabulator is 5.5. How would you go about to update ui_table to the latest tabulator version without breaking node-RED or the ui_table?
Unfortunately, some info found in the ui_table documentation is not very helpful, unless you have a sufficient understanding of JavaScript and callback functions.
I was trying to get the values of Get Current Sorters() properties, but had no luck so far.
As an alternative, sending a command getSorters did not help either. To me it is no clear which of the commands are actually supported in the ui_table in node-red. It may also very well be, that I misunderstand the way these functions work, as explained in the tabulator documentation.
I probably need to create a callback function myself, in order to get this working.
However, I do require a better understanding of callback functions etc. in order to be able to apply this in an efficient and intelligent way.
Do you have any info’s or videos on this subject or by any change any recommendation?
Greetings and thank you very much for any practical advice.
Heinz
Hi
Sorry afraid not. I did look at the table_ui node in some detail about a year ago but have only used the basics since.
If you contact me on the ask steve page and then later email me the flow or part flow I will take a look and see if I can get the commands to work.
Rgds
Steve
Hi Steve,
Thank you very much for your quick reply. I’ll be having another go on my own.
But thank you for offering your help and expertise. I still enjoy and learn a lot from your videos and publications.
Greetings and take good care.
Heinz
Hello,
Thank you for this very clear description. I’m using Node-red on a Rasberry and for UI-Table to work, I have to restart the service. Then I can only access the dashboard containing this table, the others are no longer accessible. To find the other dashboards, I have to uninstall ui-table and restart node-red on the Raspberry. Is this a known bug?
Thanks for your help.
Yves
Hi
You need a reset button on the dashboard that actively restores the other groups. Once you hide them they staty hidden until you actively unhide them. Does that make sense?
Rgds
Steve
Thanks for answer. If I add a button, it isn’t on the dashboard. And how make a reset ?
Thanks for your help.
Yves